What You Should Know About Air Quality Alerts
“It’s a code red day for ozone.” If you hear this on your local news, what does it mean? Are you at risk? Do you know what to do?
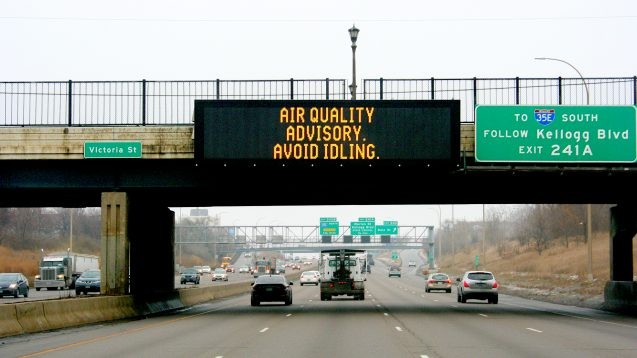
“It’s a code red day for ozone.” If you hear this on your local news, what does it mean? Are you at risk? Do you know what to do? An air quality alert like this informs the public about pollution levels in the air and advises vulnerable groups—such as the elderly, children, and people with lung disease—to take precautions.
What air quality alerts tell us
The U.S. Environmental Protection Agency (EPA) created the Air Quality Index (AQI) to monitor and report on air quality each day and let people know about its possible health impacts.
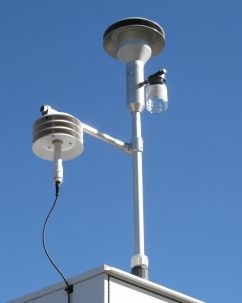
Monitors record pollution at over 1000 locations in the U.S. for four major pollutants regulated by the Clean Air Act—ground level ozone, particulate matter, carbon monoxide and sulfur dioxide. A level of 100 is deemed safe for each pollutant. An AQI number under 100 signifies good or acceptable air quality, while a number over 100 is cause for concern and triggers an alert for vulnerable groups. If two or more pollutants exceed 100, the highest number becomes the value for the day, and agencies must alert all the groups that are vulnerable to those pollutants. Levels over 300 mean very hazardous conditions.
State and local agencies must report the Air Quality Index daily in U.S. cities with populations over 350,000; smaller cities may also do it as a public service.
The four pollutants
Ozone
When it’s up in the Earth’s stratosphere, ozone gas protects us from harmful ultraviolet rays. But ground level ozone, a major component of smog, can cause coughing, chest tightness or pain, decrease lung function and worsen asthma and other chronic lung diseases. It can harm the lining of the lungs, make lungs more vulnerable to infection, and potentially damage them permanently.

Ground level ozone is produced when emissions from vehicles, power plants, industrial boilers and other fossil fuel burning facilities react with sunlight. It often forms in warmer months when there is more sunlight, and peaks during rush hour when many cars are on the road.
Each year, ozone causes about 400 premature deaths, more than 800 hospital visits, and 4,000 emergency room visits in New York City.
Particulate matter
Particulate matter (PM) refers to small particles, both solid and liquid, that can enter the lungs and cause respiratory problems. Particulate matter that is between 2.5 and 10 micrometers (smaller than the width of a human hair), called PM10, arises from crushing and grinding activities and dust on roads. PM less than 2.5 micrometers, called PM2.5, can only be seen through an electron microscope. It comes from cars, power plants, wood burning, forest fires, and other combustion. In addition, ammonia from fertilized fields and manure can combine with industrial emissions to form PM2.5.
PM2.5 can penetrate deep into the lungs, enter the bloodstream, and move to other organs. It can cause coughing, wheezing, shortness of breath, palpitations, and fatigue; it can also aggravate asthma and chronic bronchitis, and has been linked to cardiac arrhythmia and heart attacks.
In New York City, PM 2.5 is responsible for 3,000 deaths, 2,000 hospital admissions, and 6,000 emergency room visits each year.
Carbon monoxide
Carbon monoxide—a colorless, odorless gas—forms when carbon does not burn completely. Most carbon monoxide pollution comes from vehicles, but it is also caused by industrial combustion, wood burning stoves and wildfires. High levels of carbon monoxide often occur in cold weather as cold temperatures make combustion less complete and trap the gas closer to the ground.
Because carbon monoxide decreases the amount of oxygen reaching the body’s organs, it can cause flu-like symptoms and chest pain in those with cardiovascular disease. While everyone is susceptible to carbon monoxide poisoning, the unborn, babies, the elderly, and people with chronic heart disease, anemia, or respiratory problems are most at risk. High levels of carbon monoxide can result in dizziness, blurred vision and confusion; very high levels can cause death.
Sulfur dioxide
Sulfur dioxide is produced when coal and oil fuels containing sulfur are burned in power plants and refineries. Normally the irritating gas is kept out of the body by the nasal passages, but when physical exertion necessitates mouth breathing, sulfur dioxide can cause wheezing, shortness of breath and tightness in the chest. Long-term exposure can aggravate asthma and other chronic lung and cardiovascular diseases. Sulfur dioxide also contributes to the formation of particulate matter.
Who is vulnerable?
As Air Quality Index values rise, more of the public becomes vulnerable. An AQI between 0 and 50 is good. A level of 51-100 is acceptable, but a few people who are sensitive to certain pollutants may have reactions.
At 101 to 150, the air is considered unhealthy for sensitive groups: The elderly, children, and people with lung disease are vulnerable to the effects of ozone pollution; and the elderly, children and those with heart and lung disease are at risk from particulate matter. These groups should reduce their exertion outdoors.

When air quality reaches 151-200, it is considered unhealthy; everyone may now begin to experience problems, with sensitive groups feeling more serious effects. From 201 to 300, the air is judged to be very unhealthy; children, asthmatics and people with heart or lung conditions should avoid the outdoors and all others should reduce their outdoors exertion. When the Air Quality Index exceeds 300, it is “hazardous” for everyone and may prompt emergency condition alerts.
During air quality alerts, the vulnerable should reduce physical exertion and try to stay indoors with the windows closed. Those with asthma should carry their inhalers and use a face mask if they go outdoors.
What to do when air quality is poor
While people directly affected by air pollution should follow the AQI recommendations, there are also things everyone can do to improve air quality. Because most pollutants stem from the emissions of power plants and industrial boilers, conserving energy is important. Turn off unnecessary lights and turn down air conditioning. Set thermostats higher in summer and lower in winter, and use Energy Star appliances. Drive less and take public transportation or bike.

If driving, minimize idling. Refuel the car after dark so polluting emissions cannot react with sunlight and heat to create ground level ozone. Keep your car tuned and your tires properly inflated. Don’t use a gas-powered lawn mower. Choose low-VOC paint or cleaning products and seal them tight so they don’t evaporate. Avoid aerosol products, and don’t burn leaves, garbage or use wood stoves or fireplaces.
Other factors affecting air quality
Since air currents determine how pollution is dispersed, weather is also a factor in air quality and air pollution. When there is a strong wind, pollutants will be scattered quickly; when the air is calm, pollutants are concentrated and stagnant. Temperature and sunlight also affect the chemical reactions that can create ground level ozone. Rainfall generally washes away pollutants, leaving the air cleaner, but sometimes it can also dissolve sulfur dioxide, creating acid rain, which can harm soil, vegetation, streams and lakes.
Wildfires have become a leading cause of short-term exposure to polluted air. The smoke from wildfires contains carbon monoxide, PM2.5, and nitrogen dioxide, a pollutant that contributes to ozone formation. A study of the health effects of the 2015 California wildfire season, when fires ravaged over 800,000 acres, found that there had been 361,000 diagnoses related to cardiovascular issues, 15,500 related to cerebrovascular problems and 230,000 respiratory diagnoses. Emergency room visits within a day of smoke exposure rose 15 percent in general, and increased 42 percent for seniors.
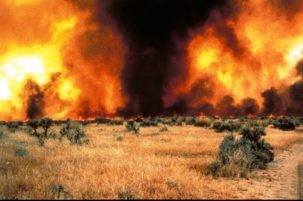
As global warming continues, climate change is raising the risk of wildfires in some parts of the country and resulting in a longer wildfire season. Warmer temperatures and sunlight may also hasten the creation of ground level ozone and smog, while warmer weather may lengthen the summer smog season in certain areas.
With increasing risks of air pollution, air quality alerts are more important than ever to protect public health. But how well do they really work?
How effective are air quality alerts?
A study conducted in Toronto, Canada from 2003 to 2012 found that air quality alerts alone had limited effectiveness in protecting public health. Alerts reduced emergency room visits for asthma by 25 percent, but did nothing to reduce deaths from cardiovascular or respiratory diseases, or hospital visits for cardiovascular disease. The researchers concluded that air pollution is a larger problem that needs to be addressed on a long-term basis through “enforceable actions” such as restrictions on driving or burning fossil fuels.
For example, in Chile, where air pollution is much worse than in Toronto, enforceable measures such as closing factories and prohibiting biomass burning on alert days resulted in 20 percent less air pollution and prevented 20 deaths per million people per day.
How are other countries faring?
“On average globally air quality is improving. But that’s subject to change with growth in population and urbanization as well as industrialization,” said Alexandra Karembelas, a postdoctoral research scientist at Lamont-Doherty Earth Observatory whose work evaluates air quality and human health effects in India.

According to the World Health Organization (WHO), 11 of the 12 cities with the worst PM2.5 pollution are in India. While WHO’s safe level for PM2.5 is 25 micrograms per cubic meter, the yearly average in Kanpur (the most polluted city in the world) is 319 micrograms per cubic meter. One report estimated that in 2015, 2.5 million premature deaths could be attributed to pollution. India’s pollution comes mainly from cars, cookstoves burning coal and wood, dust storms, and forest fires. The country’s topography also serves to trap polluted air over some areas. And while anti-pollution laws exist, they are weakly enforced.
Karembelas explained, “In places like India, the government is very focused on meeting the basic needs of the population so they haven’t implemented much to curb the pollution.” But there have been some efforts to improve air quality through odd/even license plate restrictions in Delhi, and now there is talk of eliminating cars more than 15 years old within three years.
Cook stoves are another avenue for improvement, said Karembelas. “They’re trying to improve access to cleaner fuels and cleaner energies, but it’s a challenge to bring that access to all the rural communities.”
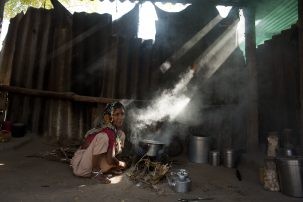
One of the challenges, she said, is the cost barrier between free biomass, such as wood, and cleaner-burning fuels such as liquid petroleum gas. “There’s also a cultural barrier, because they’re used to cooking a certain way.”
To determine the most effective ways to address India’s air pollution, Karembelas is using models to assess how future changes in different energy combustion sectors (such as residential biomass burning or transportation) could affect air quality and human health in 2030.
Air pollution is a problem in developed nations as well. It causes 500,000 premature deaths each year in Europe.
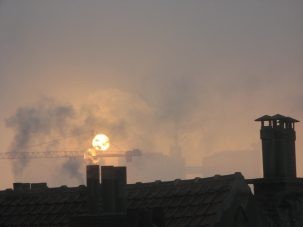
Most of the pollution there is due to traffic and smog from power plants and industry. Eighty-five percent of European urban dwellers are exposed to particulate matter at levels higher than what WHO considers safe. But there is growing awareness that air quality alerts are important, and more forecasting information is becoming publicly available. The AirText service operating via smart phone and text in London and Riga, Latvia alerts users about pollution levels. A daily 60-second air quality forecast of major European cities, launched in 2017, broadcasts four times a day on 10 channels and in multiple languages. Germany is also developing an app that alerts the public about air quality in cities, and Greece’s DiscoverAir program will soon inform tourists about air quality, weather, pollen and UV rays.
In China, which is notorious for severe air pollution, PM2.5 levels fell 33 percent in 74 cities between 2013 and 2017. Levels in Beijing fell 54 percent.
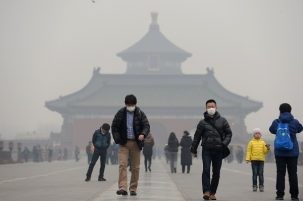
This progress is due to government policies that required millions of homes and businesses to stop burning coal and switch to natural gas, closing old steel mills and coal mines and instituting new emissions standards for coal plants. To reduce pollution in northern China, a winter-heating plan will replace coal with natural gas, biomass, heat pumps, electric heating and geothermal energy.
China monitors daily air pollution in 163 major cities and implemented a four-color alert system in 2013. Recently Shanghai revamped its system, lowering the Air Quality Index level that triggers an alert for smog.
China’s efforts have been a response to a growing urban middle class that has been vocal about its desire for clean air. “With greater access to cleaner energies and movement into the middle class and wealthier economies, people generally have higher expectations,” said Karembelas. “They want to be able to have access to a cleaner environment.”
To monitor your air quality
Karembelas recommends the website AirAirAir.org and the hashtag #airairair with the city you’re in for air quality updates. “It’s a very user friendly tool that lets you easily understand what the air quality is at present, how it’s changed and what the forecast is.”
In New York City, you can sign up for local air quality alerts at NotifyNYC.
The EPA’s AirNow website offers daily Air Quality Index forecasts and real-time conditions for over 300 cities across the United States, with links to more detailed state and local air quality websites.
AirNow’s international site provides links to Air Quality Indices from other countries.
The World Air Quality Index Project shows real time air quality at 9,000 stations around the world.
