Hudson River Mapping
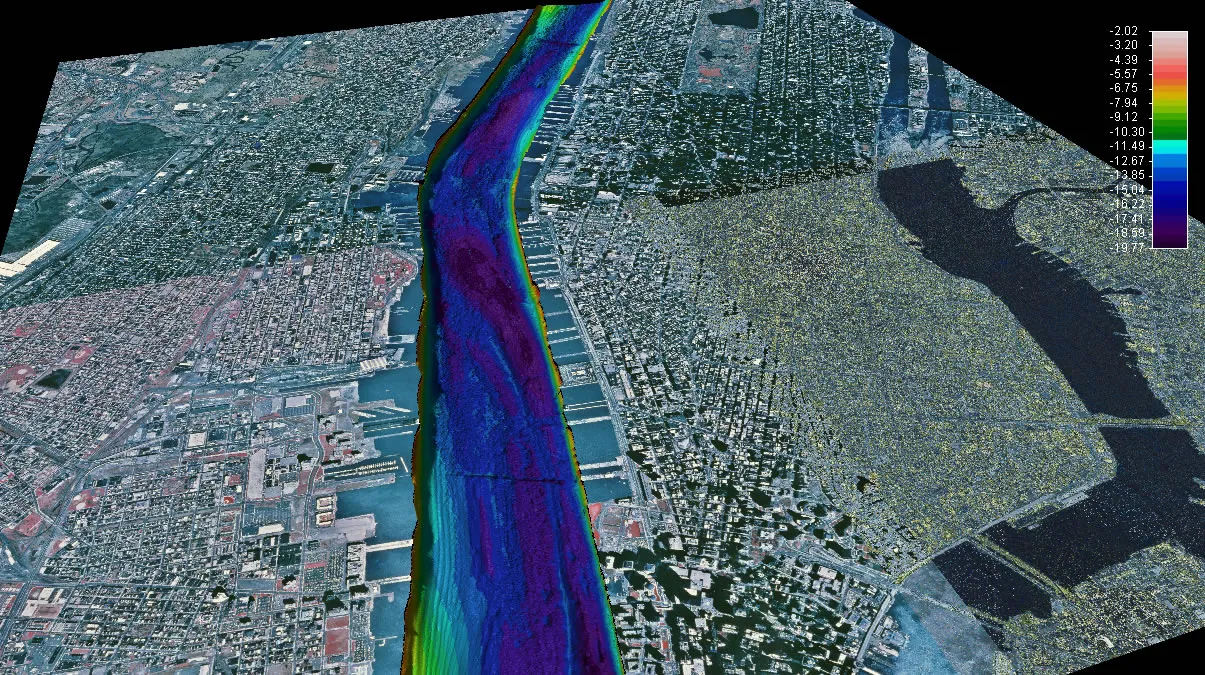
Until late in the 1990s, we were unable to 'visualize' the bottom of the Hudson River. In 1998, the New York State Department of Environmental Conservation through the Hudson River Estuary Program (HREP) began an extensive mapping project in partnership with Lamont-Doherty Earth Observatory and SUNY Stony Brook. The HREP was interested in learning about the habitats that existed underneath the water in the estuary. The project mapped the estuary bottom from Troy all the way down to the Battery collecting information on the depth, bottom features, bottom surface hardness and sediments, and human impacts. This was done using geophysics (GPS, multibeam swath mapping by SUNY Stony Brook, sidescan sonar, and sub-bottom profiling using CHIRP and ground-penetrating radar). Maps were created that show river depth, sediment grain size and type, the river bottom shape, and the impact of humans on the river. For more visualizations on the Hudson River, visit researcher Frank Nitsche’s website.
Project:
Frank Nitsche, Lamont-Doherty Earth Observatory
Project Scientists:
Frank Nitsche, Lamont-Doherty Earth Observatory
Robin Bell, Lamont-Doherty Earth Observatory
Bill Ryan, Lamont-Doherty Earth Observatory
Suzanne Carbotte, Lamont-Doherty Earth Observatory
Angela Slagle, Lamont-Doherty Earth Observatory
Vicki Ferrini, Lamont-Doherty Earth Observatory
See Educational Resources: Grades 6-12 Lessons & Activities to explore data visualizations and fly-through movies that explore the bathymetry (depth of the water) of the Hudson. Explore this research with your students using PowerPoint lessons that are tailored to different sections of the Hudson.