Grades 6-12 Lessons and Activities
Climate LIVE K12
Climate LIVE K12 is a virtual platform dedicated to bringing the science of sustainability to you! This online video series provides educational content to K12 students and educators. The series features scientific experts in 60-minute live sessions where they share aspects of their work through lectures, interactive activities, and/or demos. The Field Station has produced a number of Climate LIVE sessions pertaining to Hudson River science that you can explore with your students!
- The Hudson’s Habitat (Grades 6-8)
- Fish on the Move: Migration and Fish Management (Grades 9-12)
- Submerged Aquatic Vegetation (SAV) Role in the Hudson River System (Grades 9-12)
Day in the Life of the Hudson and Harbor
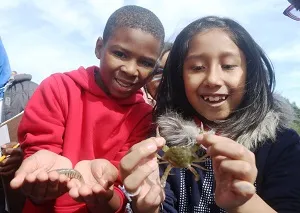
Day in the Life of the Hudson River and Harbor (DITL) is an event designed to celebrate the Hudson River Estuary and educate participants on the uniqueness of our estuary. The event is coordinated by The Hudson River Estuary Program of New York State Department of Environmental Conservation and Lamont-Doherty Earth Observatory. Each fall, environmental education centers are encouraged to team with school classes along the Hudson River to create a day-in-the-life picture of the river from the Troy Dam to New York Harbor. The event began in 2003 with a modest 300 student participants and grew by 2019 to over 5,000 students and individual participants at ~90 sites from the New York Bight up to Peebles Island on the Hudson River and into the Mohawk watershed, a major Hudson River tributary. Each site gathered data on the Hudson and shared their results, gaining a better understanding of this historic and vital estuary system.
The DITL website offers access to Data, Lesson Plans, Activities, and Resources to join us on a virtual exploration of the river!
Hudson River Mapping
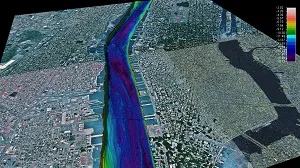
In 1998, the New York State Department of Environmental Conservation through the Hudson River Estuary Program (HREP) began an extensive Hudson River mapping project in partnership with Lamont-Doherty Earth Observatory and SUNY Stony Brook to visualize the bottom of the river. The project mapped the estuary bottom from Troy all the way down to the Battery collecting information on the depth, bottom features, bottom surface hardness and sediments, and human impacts.
The data has been translated into visualizations to see the bathymetry (depth of the water) of different sections of the Hudson. The river has been divided into different sections so you can compare and contrast different areas with your students. For each site, there is PowerPoint (also offered as a PDF) with background information available in "Notes" view to share with your students. Small movie fly-throughs of the various parts of the river are also available (credit Frank Nitsche, Lamont-Doherty Earth Observatory). For more visualizations on the Hudson River, visit Frank's research page on his website.
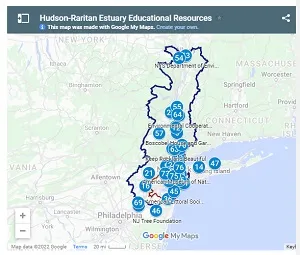
Educational Resource Guide for Parents and Teachers
The Educational Resource Guide provides parents and teachers alike with effective educational resources to help meet curriculum course requirements or to simply offer a fun family activity about the Hudson River Estuary. As a part of the Harbor and Hudson River work group, we have reinvented our programs to incorporate new virtual and at-home lessons and activities! Housed on the Hudson River Foundation website, the Educational Resource Guide seeks to offer a searchable, sortable collection of sustainability-related, place-based resources from environmental educators across the Hudson Estuary.