
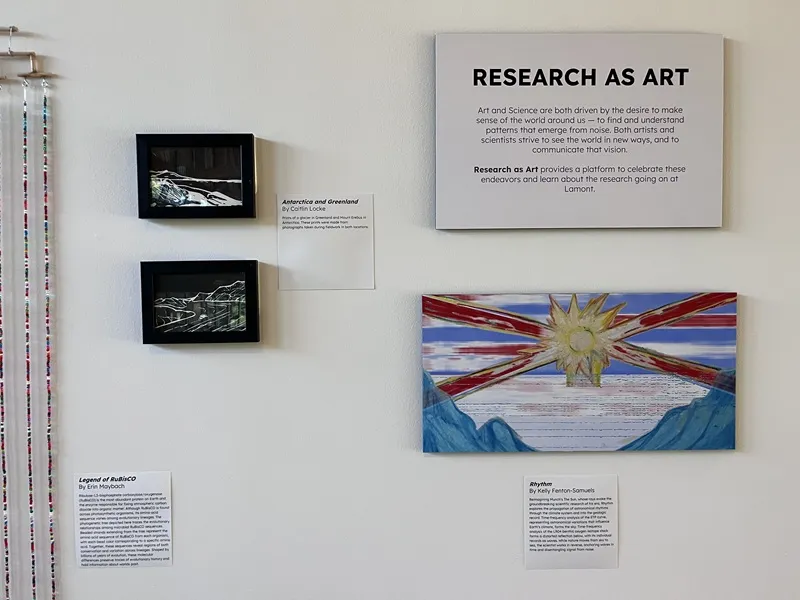
Art and science are both driven by the desire to make sense of the world around us — to find and understand patterns that emerge from noise. Both artists and scientists strive to see the world in new ways, and to communicate that vision.
Lamont's Research as Art 2026—organized by Lindsay Hogan, Ally Peccia, Hanna Anderson, and Phoebe Salowey—provides a platform to celebrate these endeavors and learn about the research going on at Lamont-Doherty Earth Observatory. The 2026 exhibit remains on display in the the Monell Building through September 30, 2027.
Learn more about how Art Meets Science at Lamont and our in-person exhibits on display.
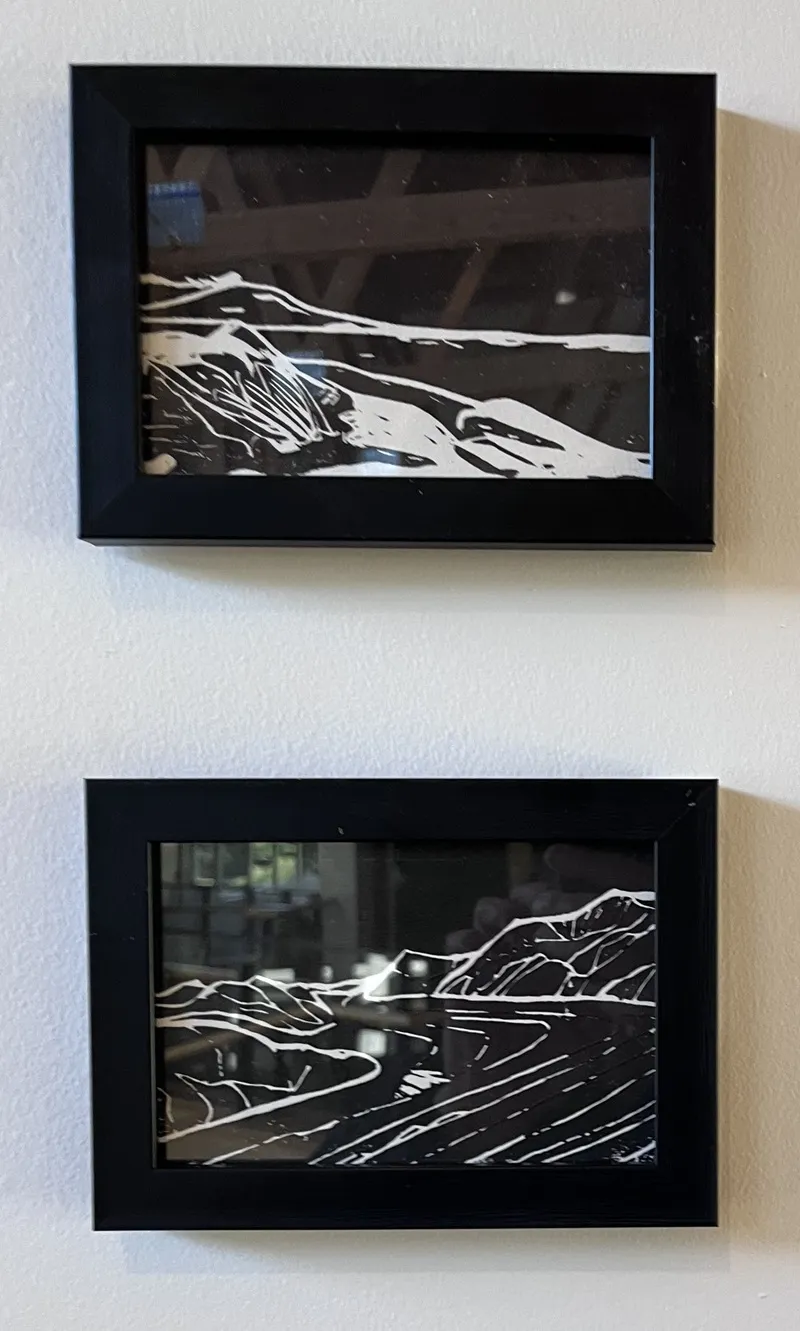
Antarctica and Greenland
By Caitlin Locke
Prints of a glacier in Greenland and Mount Erebus in Antarctica. These prints were made from photographs taken during fieldwork in both locations.
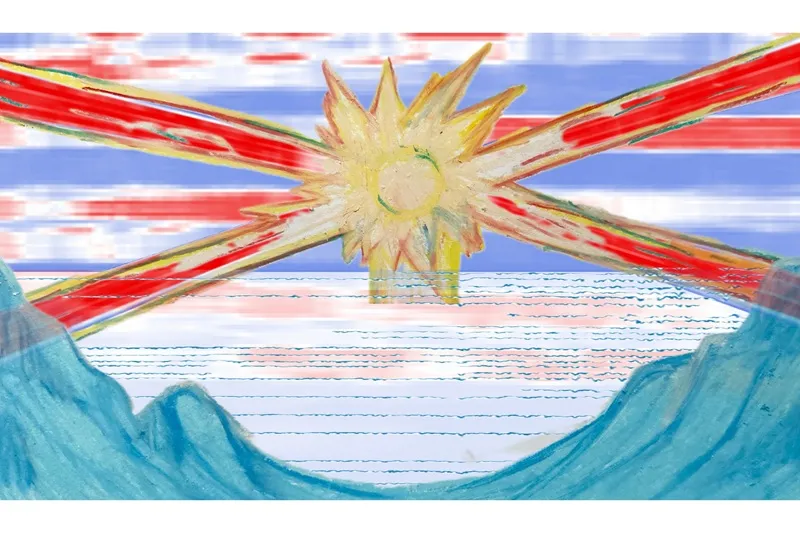
Rhythm
By Kelly Fenton-Samuels
Reimagining Munch’s The Sun, whose rays evoke the groundbreaking scientific research of his era, Rhythm explores the propagation of astronomical rhythms through the climate system and into the geologic record. Time-frequency analysis of the ETP curve, representing astronomical variations that influence Earth’s climate, forms the sky. Time-frequency analysis of the LR04 benthic oxygen isotope stack forms a distorted reflection below, with its individual records as waves. While nature moves from sky to sea, the scientist works in reverse, anchoring waves in time and disentangling signal from noise.
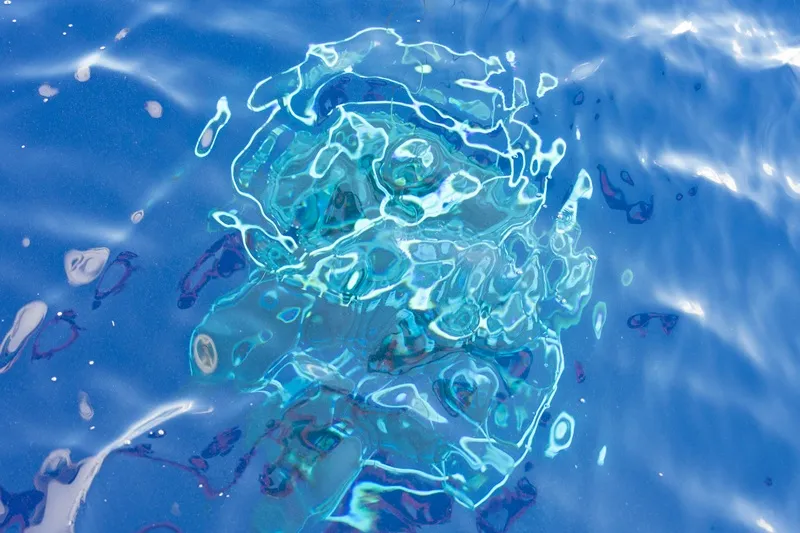
Blue Rose
By Ce Bian
A CTD rosette descends nearly 100 meters into the clear Pacific. Seen through the shifting surface, its steel frame and sampling bottles dissolve into light, motion, and blue. Built to measure the ocean, the instrument briefly becomes what its name has always suggested: a blue rose blooming beneath us.
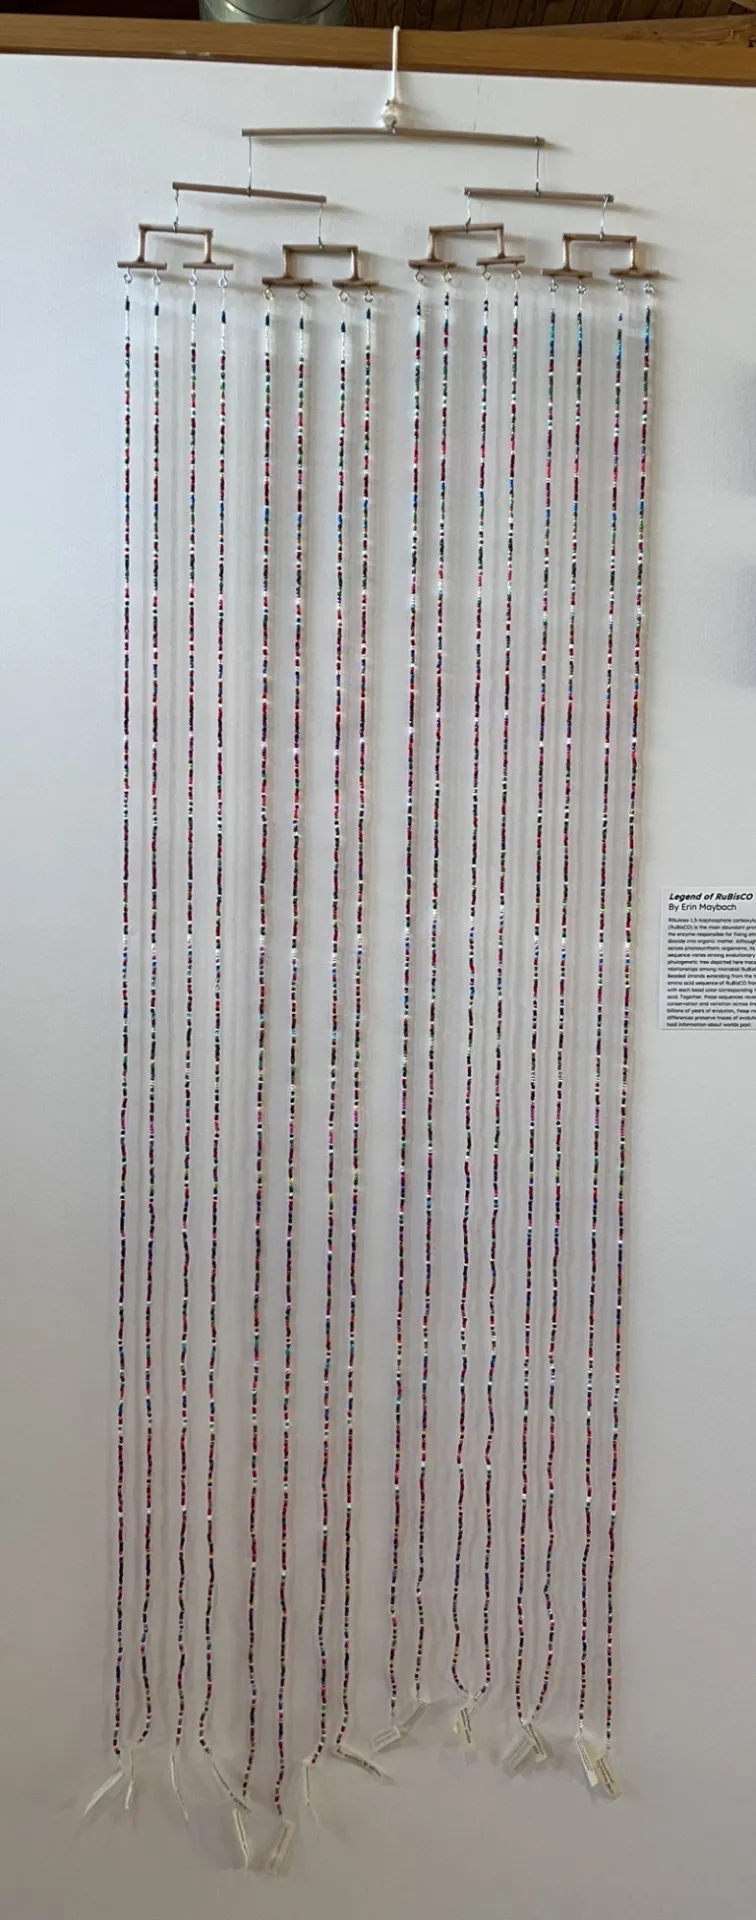
Legend of RuBisCO
By Erin Maybach
Ribulose-1,5-bisphosphate carboxylase/oxygenase (RuBisCO) is the most abundant protein on Earth and the enzyme responsible for fixing atmospheric carbon dioxide into organic matter. Although RuBisCO is found across photosynthetic organisms, its amino acid sequence varies among evolutionary lineages. The phylogenetic tree depicted here traces the evolutionary relationships among microbial RuBisCO sequences. Beaded strands extending from the tree represent the amino acid sequence of RuBisCO from each organism, with each bead color corresponding to a specific amino acid. Together, these sequences reveal regions of both conservation and variation across lineages. Shaped by billions of years of evolution, these molecular differences preserve traces of evolutionary history and hold information about worlds past.
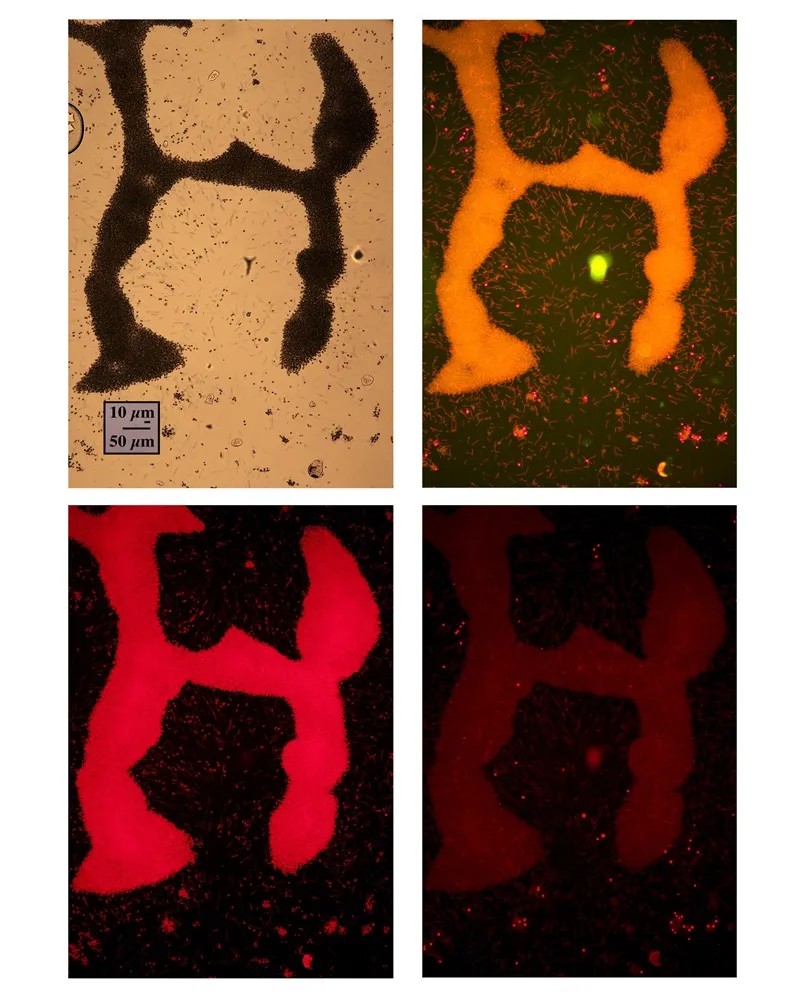
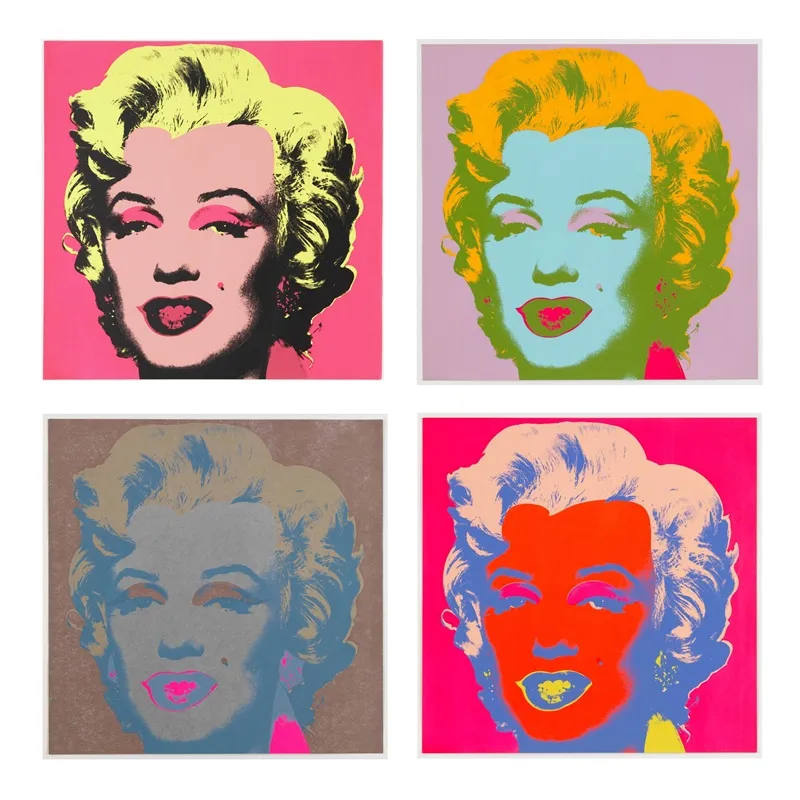
Microcystis meets Marilyn
By Andrew Juhl
[Represents a modest tribute to Andy Warhol]
Scatterplots of sub-tropical North Atlantic and global tropical ocean temperatures from the ensembles of model runs for the 100 years of pre-Industrial control experiments (green circles), the twentieth century/historical simulations (blue dots), and the twenty-first century projections for the strong warming scenario (red squares), produced within the Coupled Model Intercomparison Project for the Fifth IPCC Assessment Report. The first 29 panels display the individual models’ ensemble means, and the last one (in the lower right corner) corresponds to the mean of the entire multi-model ensemble. [From Giannini and Kaplan (2019)].
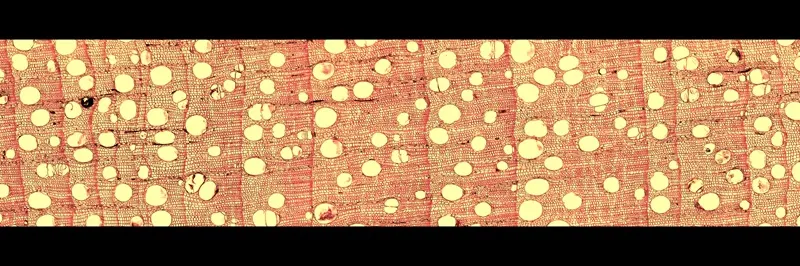
Submerging in the Tree
By Eugenia Marcotti
The inside of trees holds answers to the environmental conditions that shaped their growth. This anatomical section of Juglans australis (Argentina) reveals rings of varying width and character—a climatic narrative etched in wood through which we will reconstruct the history of droughts. This work is carried out in collaboration with Dr. Mukund Palat Rao (Tree Ring Lab).
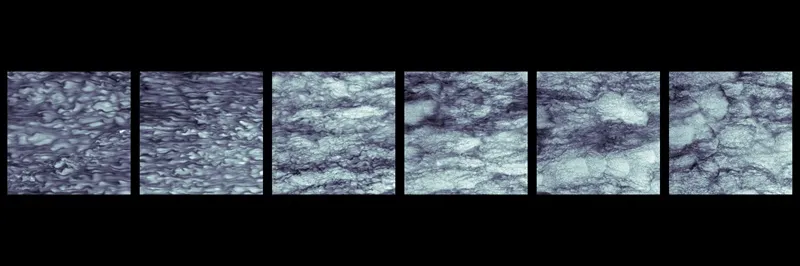
Thermal Surface Expressions
By Lindsay Hogan
Wind blowing over the water surface drives heat flux that cools the surface. As the wind speed increases, waves form and turbulence mixes the cool surface layer with the warmer water below. These are thermal images of a water surface, evolving under growing winds, with wind speed increasing from left to right.
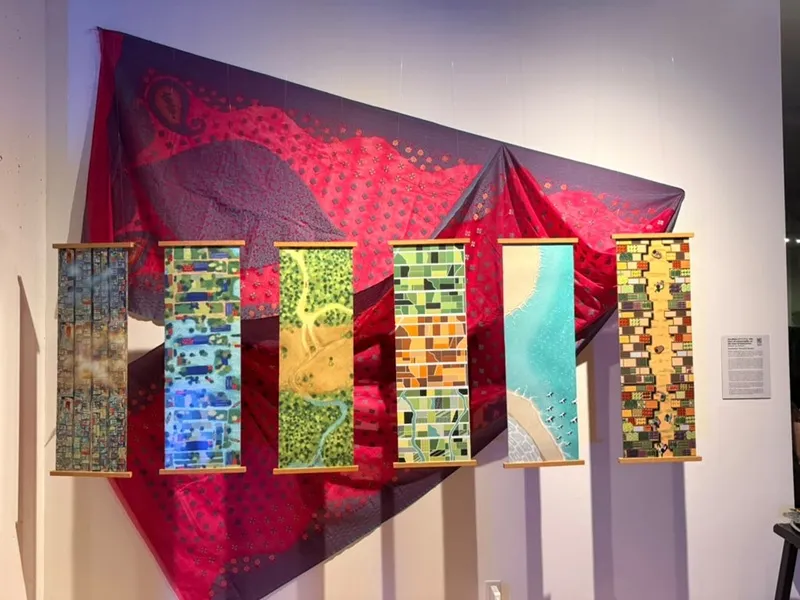
Kaalbela, Extreme Events
By Aandishah Samara
Kaalbela, Extreme Events, is a visual series of six panels which reimagines Bangladesh's climate story through its six traditional seasons, Grishsho (গ্রীষ্ম; summer), Borsha (বর্ষা; monsoon), Shorot (শরৎ; autumn), Hemonto (হেমন্ত; dry autumn), Sheet (শীত; winter) and Boshonto (বসন্ত; spring), rather than the four-season Western framework most global audiences are familiar with. Each panel shows a single season, and within it, time runs vertically from top to bottom: the season as it has been traditionally shows agricultural and daily life, moving downward, we see the same scene destabilized by the climate extremes already reshaping the country (intensifying heat and drought, prolonged flooding, coastal erosion), before resolving at the base of the panel into 2075. At the end, we find the restored and land regained through community-led ecological resistance.
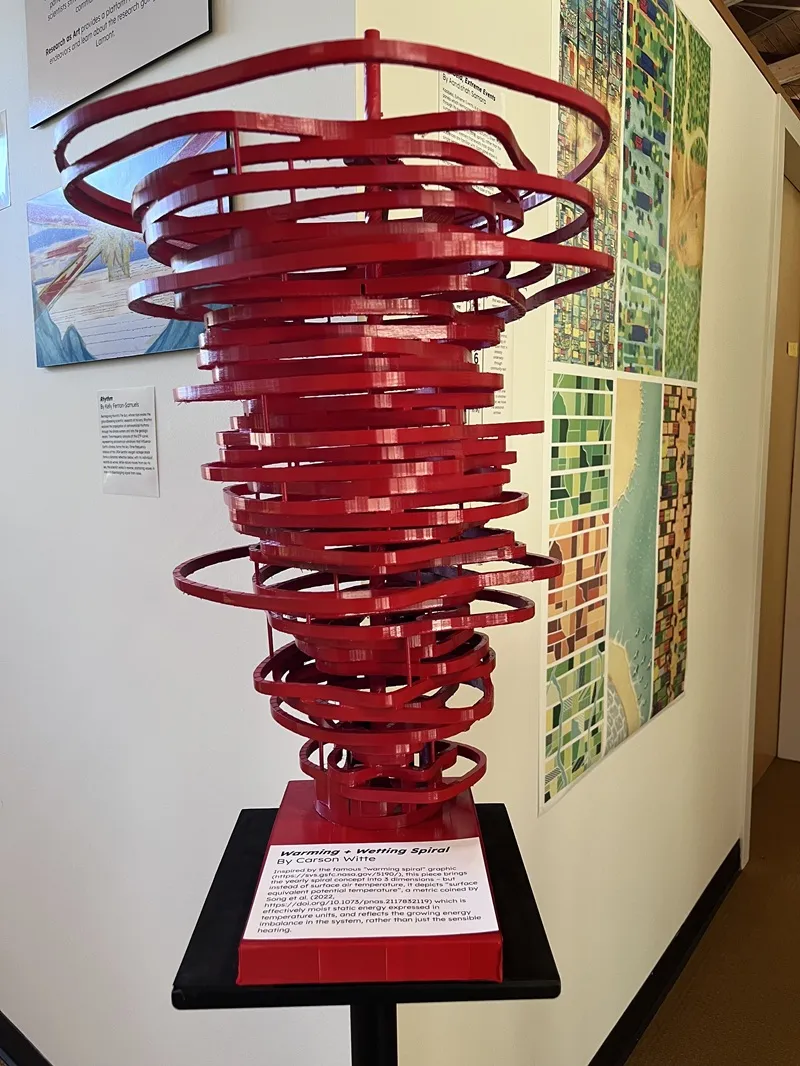
Warming + Wetting Spiral
By Carson Witte
Inspired by the famous “warming spiral” graphic, this piece brings the yearly spiral concept into 3 dimensions – but instead of surface air temperature, it depicts “surface equivalent potential temperature”, a metric coined by Song et al. 2022, which is effectively moist static energy expressed in temperature units, and reflects the growing energy imbalance in the system, rather than just the sensible heating.