
Study Links NYC Congestion Pricing Policy to Cleaner Air In Lower Manhattan
One year after NYC launched its congestion pricing policy, fine particulate pollution inside Manhattan’s congestion relief zone was 13 percent lower, according to a new analysis.
Highlights
- Researchers tracked air pollution at 15 monitoring sites across New York City during the first year of the country’s first congestion pricing program.
- Fine particulate pollution inside the congestion zone fell about 13 percent beyond what regional trends, weather and year-to-year variability would predict.
- The decline closely matched the roughly 11 percent drop in vehicles entering the zone, though pollution had already been falling citywide for other reasons.
- Nitrogen dioxide dropped more than 20 percent across the metro area, but the study could not attribute that regional decline to congestion pricing.
One year after New York City launched its congestion pricing policy, fine particulate pollution inside Manhattan’s congestion relief zone was 13 percent lower, according to a new analysis that accounted for regional pollution trends, weather and normal year-to-year variability.
“For the most part, the program appears to be working,” said Daniel M. Westervelt, a study coauthor and an associate research professor at Lamont-Doherty Earth Observatory, which is part of the Columbia Climate School. “It reduced particulate pollution inside the congestion zone by a modest amount.”
Published in Environmental Science & Technology Letters, the study is among the first year-long assessments of the Central Business District Tolling Program, which took effect on January 5, 2025, and is the first congestion pricing program in the United States. The program charges most vehicles entering Manhattan south of 60th Street in an effort to reduce traffic congestion and generate revenue for public transit.
“A full year of data helps us see whether changes in air quality remain consistent across all seasons and different weather conditions,” said first author Polina Goldberg. “Other cities have been waiting to see what happens in New York before they consider anything similar, so we wanted to get the analysis right rather than fast.” Goldberg began the research with Westervelt as an undergraduate through Lamont’s summer internship program and is now starting graduate school at Columbia.
To examine the program’s early impacts on air quality and traffic patterns, the researchers analyzed ground-level air pollution measurements from 15 sites in New York City’s Community Air Survey real-time monitoring network, along with hourly traffic counts from two major tunnel crossings into Manhattan and satellite observations of nitrogen dioxide. This combined approach allowed the team to measure changes within the congestion zone and look for possible spillover pollution into adjacent areas.
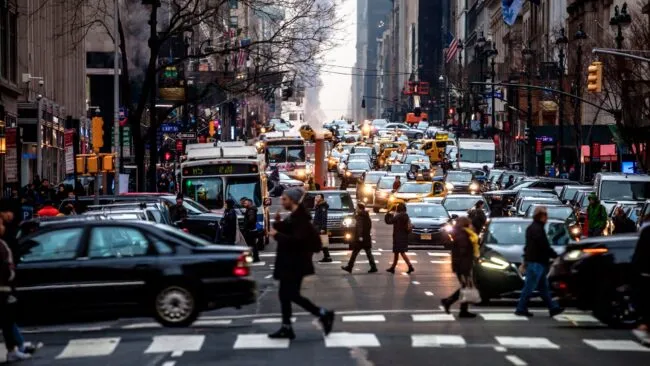
In 2025, the number of vehicles coming into the congestion zone from the Queens Midtown and Brooklyn Battery tunnels was generally lower compared to 2024. While daily traffic patterns remained similar, the number of vehicles during morning and evening rush hours declined after congestion pricing began, signaling shifts in travel behavior during the busiest periods.
Air quality improvements inside the congestion zone
Monthly and daily monitoring data showed lower levels of fine particulate pollution, known as PM2.5, in 2025 compared with 2022-2024, particularly at sites in lower Manhattan. All six representative sites examined in detail had lower median PM2.5 concentrations in 2025 than in 2022-2024, with the largest decrease, about 2.7 micrograms per cubic meter, at the Broadway & 35th Street site in midtown Manhattan. The smallest decrease was at Queens College, the site farthest from the congestion zone, where the change was not statistically significant.
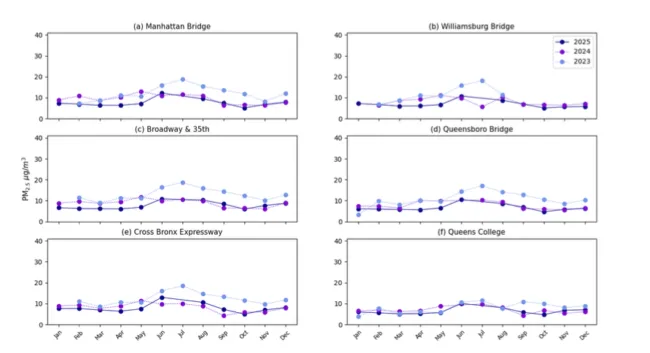
Time series of monthly-averaged PM2.5 measurements at six representative NYC monitoring sites: (a) Manhattan Bridge, (b) Williamsburg Bridge, (c) Broadway & 35th, (d) Queensboro Bridge, (e) Cross Bronx Expressway, and (f) Queens College.
Because PM2.5 has been declining across the region due to seasonal patterns and policy influences, the researchers used a statistical approach to distinguish the program’s effects from these trends. They compared sites inside the zone with sites outside it while controlling for weather and seasonal effects.
That analysis found PM2.5 concentrations inside the zone were about 1.3 to 1.4 micrograms per cubic meter, or roughly 13 percent, lower than would be expected based on trends at sites outside it. This estimate is smaller than the largest raw site-level declines, because it reflects only the share of the improvement attributable to the tolling program.
That estimated decrease broadly tracked with the roughly 11 percent drop in vehicles entering the zone, strengthening the evidence that reduced vehicle activity contributed to the observed air quality improvements. Monitoring data also showed fewer pronounced rush hour spikes in 2025, suggesting the policy reduced both average pollution levels and short-term spikes in measured concentrations.
While this study did not evaluate the health benefits of reducing PM2.5, even small changes in fine-particle pollution can matter for public health. Fine particles are linked to cardiovascular and respiratory disease, and reducing exposure is generally expected to improve health outcomes.
Map: Congestion Pricing and NO2, New York City
Map Information
Usage: Drag and drop to move map; mousewheel to zoom; select to change layer; click to view data.
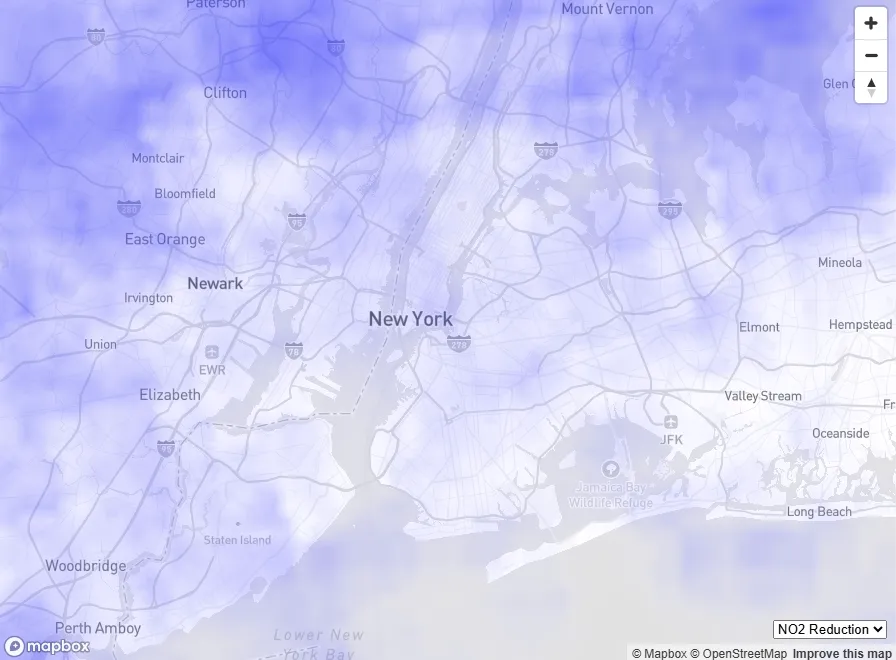
NO2 Reduction: Spatial distribution of tropospheric NO2 percent reduction (1015 molecules/cm2) across the New York City metropolitan area on cloud-free and stagnant-wind days, comparing 2025 with a 2018-24 baseline, excluding COVID19 lockdown period (Mar-Dec 2020).
NO2 Average: Predicted annual average surface NO2 in parts per billion (ppb), Dec 2022-Dec 2023. NYCCAS Air Pollution Rasters | NYC OpenData.
NO2 + Asthma: Combined predicted annual average surface NO2 and asthma emergency department visits (adults; average annual rate per 10,000) by Neighborhood Tabulation Area (NTA). Dark purple colors indicate areas in the top tertile for both asthma ER visits and annual NO2 levels. Asthma emergency department visits (adults), by NTA | NYC Environment & Health Data Portal; NYCCAS Air Pollution Rasters | NYC OpenData.
The researchers also evaluated a possible increase in PM2.5 at two monitoring sites just outside the congestion zone, near the Brooklyn Queens Expressway and in Mott Haven. The estimated increase, about 0.5 micrograms per cubic meter, did not meet conventional levels of statistical significance, but continued monitoring will help determine whether this localized spillover persists.
“It would be premature to say there were definitely increases that were directly attributable to the congestion pricing policy,” Westervelt said.
Satellite observations added context to the ground-level findings. Tropospheric nitrogen dioxide, a traffic-related pollutant that can contribute to respiratory problems and the formation of smog, declined by more than 20 percent across the New York City metropolitan area in 2025 compared with a 2018-2024 baseline.
Although nitrogen dioxide levels fell slightly more in lower Manhattan than in other city boroughs, the difference wasn’t large enough to attribute the reductions to congestion pricing. The satellite data likely reflect broader regional influences, including other air-quality policies, with congestion pricing potentially contributing to the overall decline.
The analysis also found no evidence that nitrogen dioxide concentrations increased in the outer boroughs, suggesting the policy didn’t lead to detectable increases in this pollutant in surrounding areas.
Outcomes beyond the congestion zone
By comparing conditions inside and outside Manhattan’s congestion zone, the study provides one of the first neighborhood-scale estimates of the program’s impact on air quality in a U.S. city. This evidence of how New York’s program affected air quality during its first year may help inform policymakers and urban planners in the city and elsewhere.
The results also highlight the importance of evaluating congestion pricing policies across a broad area, not just within the congestion zone, to understand how pollution patterns shift.
Westervelt said longer-term analyses, including additional pollutants and improved satellite observations, will help determine how durable the first-year improvements in air quality prove to be as traffic patterns continue to adjust to the policy.
The study was coauthored by Abhishek Anand of Lamont-Doherty Earth Observatory and Daniel L. Goldberg of the Milken Institute School of Public Health at George Washington University.