Clues to Sea Level Rise Are Hidden In and Below Greenland’s Ice
Greenland is surrounded by a ring of high mountains that work like fingers encircling the ice to hold it in place. Ice sliding from between these “fingers” into the surrounding waters results in a major human impact – Sea Level Rise.

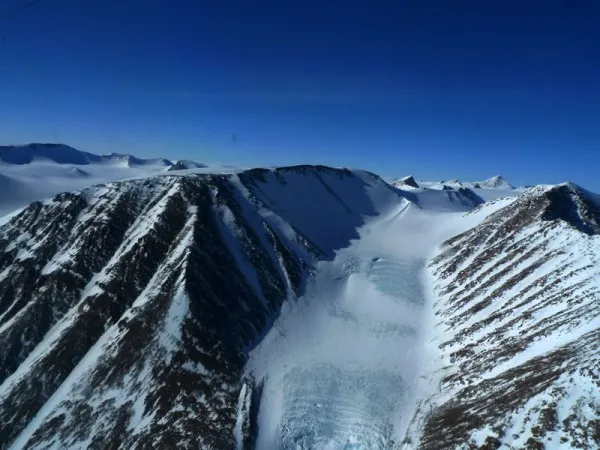
The charge is simple – Operation Ice Bridge will fly all 200 Greenland outlet glaciers with an end dimension of over 2 km. The reason? These outlet glaciers (fast moving ice bounded by mountains) are the major mechanism carrying ice off this mega-island and into the surrounding ocean. Greenland is surrounded by a ring of high mountains that work like fingers encircling the ice to hold it in place. Between these mountain ‘fingers’ ice slips through in streaming rivers transporting its frozen cargo to the sea. Ice sliding from the land into the surrounding waters results in a major human impact – Sea Level Rise.
Measuring the ice thickness (ATM, RaDAR), the shape and opening size of the land beneath the ice (RaDAR, gravity), and the type of geology (magnetics) will help with determining how much ice is on this northern land and to calculate how quickly it might move from land into the ocean. These 200 outlet glaciers are key to this calculation. Each flight mission covers a different group of glaciers, some repeating flights from earlier years to measure any change in ice elevation, and some new flights over glaciers never before measured in order to collect baseline data. In addition to flying the outlet glaciers each mission involves transit lines. Careful planning goes into laying out these lines in order to build a comprehensive ‘blueprint’ of Greenland’s land mass. Hidden under several kilometers of ice the land is slowly being pieced together with each line of data collected.

Each instrument on the plane collects valuable information for the project, but with four types of RaDAR being collected this season most of the flights include at least one of these as a ‘priority instrument’. RaDAR, an acronym for radio detection and ranging, has been a part of our vocabulary and has enhanced our understanding of the world since the Second World War. Sending out radio waves and capturing their return has provided us information on ships, aircraft, missiles, weather formations, speeding motor vehicles and – the focus of this project – the terrain. Each of the RaDAR used in Ice Bridge has been designed by CReSIS (Center for Remote Sensing of Ice Sheets) with a unique frequency and penetration for a specific use, yet all have overlap or redundancy.

For detecting the very freshest snow the Ku band is important. Ku uses the highest frequency, 12-18 GHz, providing high-resolution information on the top 15 meters of snow cover, and has been used this season to separate the snow layer thickness on top of the sea ice when trying to determine overall ice thickness. The Snow RaDAR operates at 2-8 GHz and focuses on the top 30 meters of snow cover, often an area of unconsolidated ice (the firn layer), and an interim stage between snow and glacially compressed ice. Accumulation RaDAR operates at a lower resolution of 600-900 Mhz penetrating down a full km into the ice providing data on the internal layers of ice as they collect and move over the landforms. Lastly, the MCoRDS RaDAR is the priority for information on the bed shape beneath the ice sheet. MCoRDS uses a low frequency or 180-210 Mhz to penetrate down to 4 km beneath the ice surface giving us the depth and shape of land below, and any constrictions to ice flow.
The RaDAR can provide information on the shape of the land surface but not on the geology, and if there is water it can’t image through to see what lies below. This is where Lamont’s gravity and magnetics teams work to fill in the missing information. Matching the bed shape to the gravity/magnetics information on the ‘bed’ material is important in developing our understanding of how the glacier may move in the future.
Measuring Greenland’s ice sheet and the land that holds it in check is a first step in a long walk that will take us to predicting the future of that ice sheet and its impacts on sea level rise. Every line of Ice Bridge data collected fills a blank that moves us closer.
**************
Special thanks to Aqsa Patel & Kevin Player for their willingness to answer all my questions on the CReSIS radar systems, and Beth Burton and Kirsty Tinto on the magnetics and gravity systems.
For more blogs on this project: http://blogs.ei.columbia.edu/tag/greenland-ice-sheet/
For more on this project at LDEO: http://www.ldeo.columbia.edu/icebridge
For more about NASA Ice Bridge: http://www.nasa.gov/icebridge/