A Brief History of Ocean Research at Lamont-Doherty Earth Observatory, Past and Present
In honor of World Oceans Day on June 8.
World Oceans Day (June 8) honors the salty waters that cover 70 percent of the planet. The oceans host the majority of the world’s biodiversity, provide a vital source of food and other resources, and play an important role in regulating the global climate.
Columbia University’s Lamont-Doherty Earth Observatory is at the forefront of ocean research. Learn more about our scientists’ work in the video below.
The modern-day scientists in the video come from a rich legacy of ocean exploration — researchers at Lamont have been trawling the oceans’ secrets for decades. Here are some of their history-making contributions to marine science.
Charting the Sea Floor
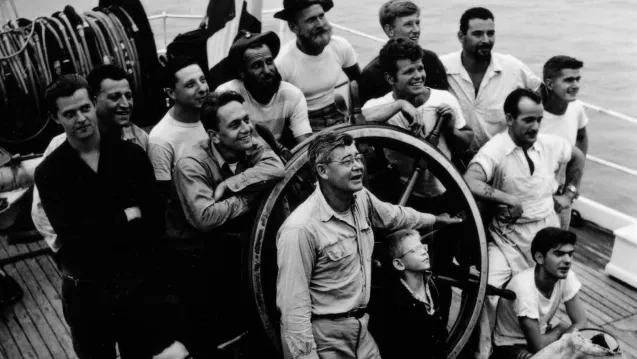
At the time when what was then called the Lamont Geological Observatory was established in 1949, very little was known about the structure of the seafloor. The prevailing wisdom was that the bottom of the ocean was flat and featureless, like the bottom of a bathtub. Lamont’s first director, Maurice “Doc” Ewing, set out to investigate aboard the research vessel Vema. The team measured ocean depths across millions of miles, using sound waves aimed at the seafloor and measuring how long it took for the “echoes” to reflect back to the ship’s detectors.
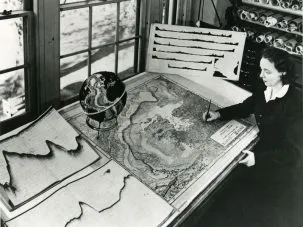
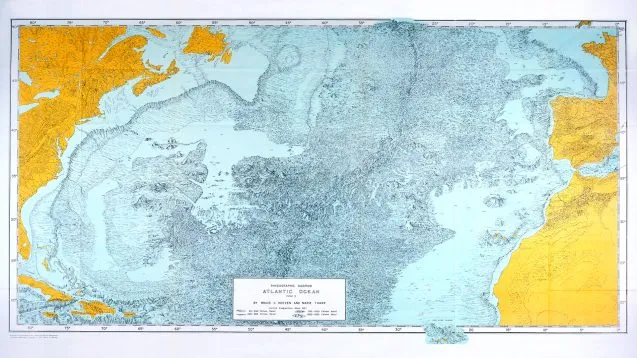
Marie Tharp and her colleague Bruce Heezen made history by turning those depth measurements into detailed maps of the ocean floor. They published the first map of the Atlantic seafloor in 1957, and the first map of the entire world’s ocean floor in 1977.
Tharp and Heezen’s maps revealed that the seafloor was far from flat and featureless. Instead, they charted underwater mountains, canyons, and a globe-girdling series of mid-ocean ridges that would later help to prove that Earth’s continents move over time.
Paving the Way for Plate Tectonics
On a research cruise to the south Pacific in 1966, then Lamont grad student Walter Pitman made a discovery that would shake the world. The ship, the Eltanin, had been towing a magnetometer behind it, capturing the magnetic alignment of the rocks on the seafloor below. Over the course of millennia, Earth’s poles reverse, and igneous rocks record those magnetic reversals in the alignment of their minerals.
Back at Lamont, while looking at the recordings captured while the ship crossed a mid-ocean ridge, Pitman realized that the pattern of magnetic reversals was symmetrical, with the mid-ocean ridge as the center point. He almost instantly knew he was seeing evidence of seafloor spreading — that the seafloor formed from lava at the mid-ocean ridges and spread outward from there. The discovery was essential in proving that the Earth’s crust is composed of plates that move over time.
Read more about the discovery here.
Digging Up Earth’s Past Climate
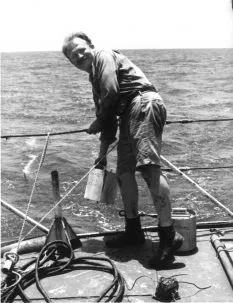
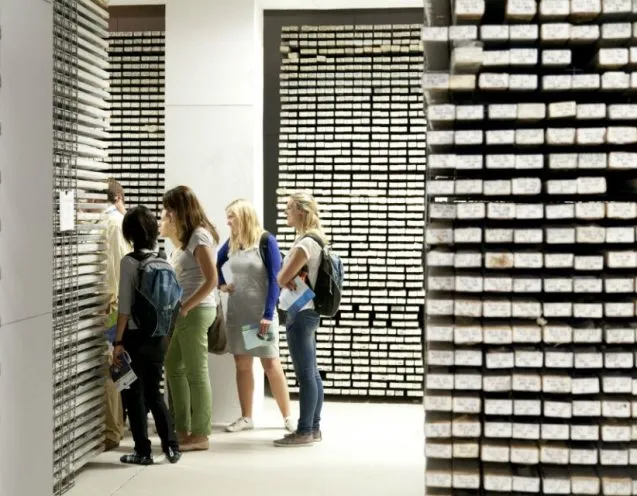
Just as rock layers on land have helped to reconstruct Earth’s history, sedimentary layers under the seafloor record important information from past millennia. Recognizing this potential, Lamont founder “Doc” Ewing began extracting vertical samples from the seafloor as early as 1947, aiming to collect “a core a day.” Cores are tubes of sediment layers drilled from under the ocean. The sediments and fossils in each layer can reveal important climatic events, such as volcanic eruptions and periods of warming or cooling, going back millions of years.
Today, Lamont’s Core Repository is home to nearly 19,000 cores and is a resource used by scientists all over the world. Among the many discoveries that have come out of the repository, researchers at Lamont and other universities have analyzed the climate signals in many cores to prove that changes in astronomical cycles have helped to drive Earth’s glacial cycles.
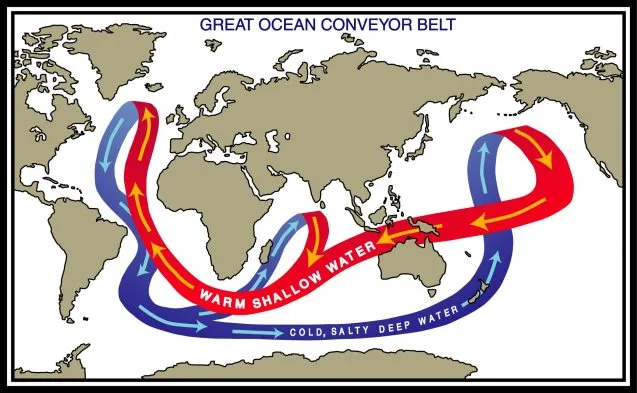
Mapping Ocean Circulation
Setting sail in the 1960s, geochemist Wallace Broecker helped to map global ocean circulation and its powerful effects on climate. He used carbon isotopes to overturn the idea that it took thousands of years for water to circulate between shallow and deep regions of the ocean, showing that it instead took hundreds of years. This work opened up the possibility for the oceans to influence climate and vice versa. One of his greatest contributions (other than coining the term “global warming”) was to synthesize a vision of what he called the “great ocean conveyor” — a circulation pattern whereby warm shallow waters from the tropics carry heat poleward, then cool and sink and return toward the tropics. This conveyor belt plays an important role in regulating climate.
Linking the Oceans and Climate
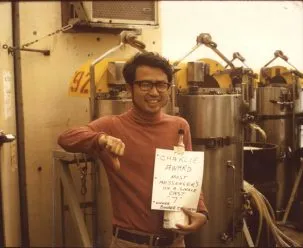
Broecker was part of a whole generation of scientists at Lamont who helped to refine our understanding of the relationship between the oceans and climate. Also among them was geochemist Taro Takahashi, who helped discover the ocean’s vital role in soaking up carbon from the atmosphere in some places, while giving it off in others. When Takahashi began his research in the 1950s, scientists knew that the burning of fossil fuels was sending vast quantities of carbon dioxide into the atmosphere, but the atmosphere contained only about half of the emissions that were expected to be there. Takahashi and his colleagues analyzed millions of shipboard measurements to discover that the oceans absorb a quarter of the emissions when cold water sinks, and that it can store the carbon for hundreds of years before sending it back to the surface. This work was fundamental in understanding the global dynamics of carbon dioxide.
Unlocking the Secrets of El Niño
The natural climate cycle known as the El Niño–Southern Oscillation influences temperature and precipitation patterns around the world, sometimes leading to devastating climate events. The seasonal weather conditions of El Niño are driven by sea-surface temperature and wind patterns over the Pacific Ocean, but the phenomenon’s physics and timing remained mysterious until a 1986 paper by Lamont scientists Mark Cane, Stephen Zebiak, and Sean Dolan. The team’s model, which brought together atmospheric and oceanic dynamics, was the first to explain how the phenomenon worked, and to successfully predict an El Niño event. Stephen Zebiak later became the second director of Columbia’s International Research Institute for Climate and Society.
Continuing to Plumb the Oceans’ Hidden Depths
Today, researchers at Lamont-Doherty Earth Observatory and other parts of Columbia University continue to revolutionize our understanding of the global ocean, from below the seafloor to its effects in the atmosphere and on land. They persist in mapping the seafloor and refining our understanding of ocean circulation, carbon uptake, marine ecosystems, tropical cyclones, and how rising sea levels may impact human populations in the future. Learn more here and in the video at the top of the post.