Day in the Life Data
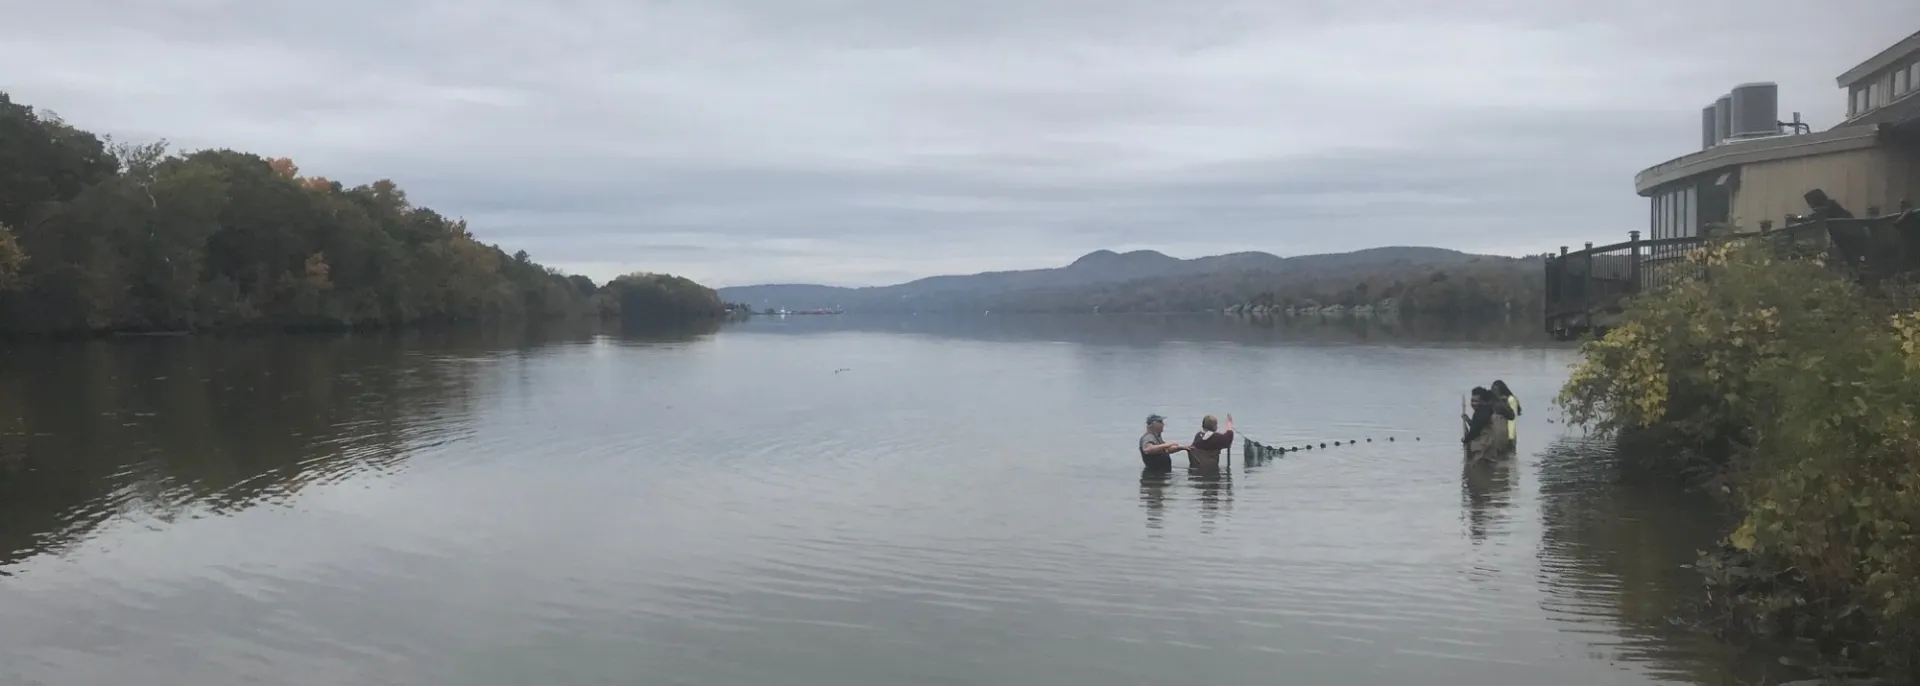
Each Day in the Life site gathers data on a range of parameters that include physical, chemical, biological and other characteristics of the Hudson. Data is then organized so that participants and educators can view results by year, by sampling site, by specific parameter, or by seeing how each site fits into the rest of the Hudson River.
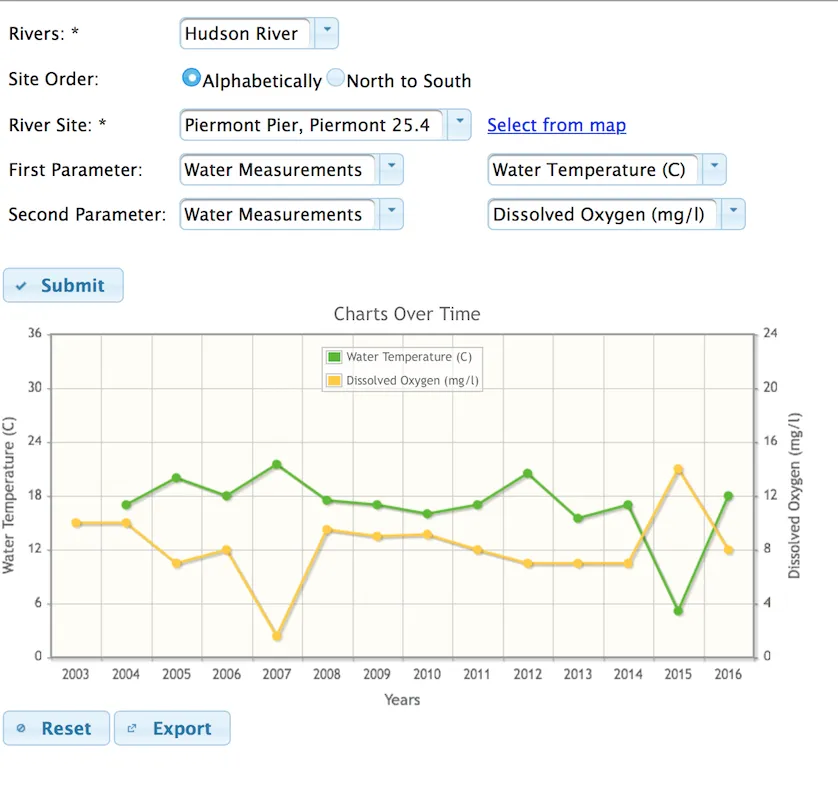
Another way to explore the data is through our two interactive databases. The top database focuses on comparing sites along the river for a selected year. The bottom database focuses on how sites have varied over time. Hoovering over a datapoint provides the year and number represented in the parameter. You can zoom in on a section of the graph by selecting an area with your cursor. Finally, you can download the graph. Spend some time and explore the data to learn all about our estuary.
Interactive Database
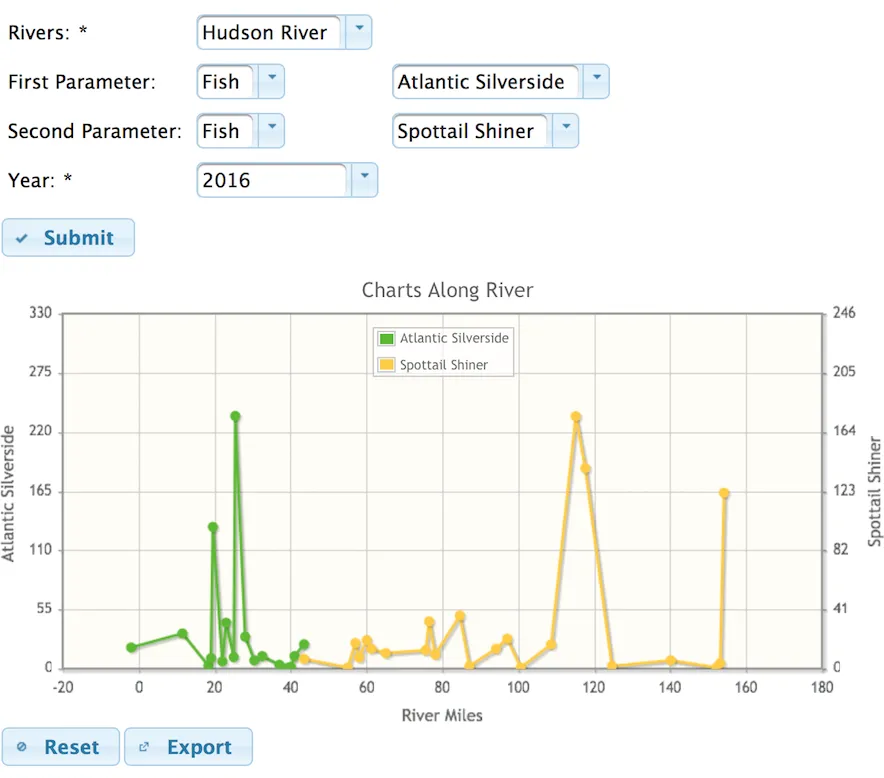
Link to Chart Along River
Link to Chart Across Time
NEW FEATURE! Have you ever wondered how many fish of a specific species we have caught through the years? We have developed a new tool so you can see that! Just follow these steps!
- Select the river you are interested in (Do NOT select a specific site, just the river).
- For the parameter pick fish and whichever fish you are interested in (you can select up to two fish)
- Hit submit!
The ability to look at the data across time by site is also still available but this new feature allows you to look across the system. Note that this feature is only for looking at fish!
Data by Years, Sites and More
Each year we have complied a cumulative datasheet. The most recent datasheets (2020 through present) are compiled in google sheets with the first tab being the participating sites. Earlier sheets are collated in excel files.
- 2025 Cumulative Data
- 2024 Cumulative Data
- 2023 Cumulative Data
- 2022 Cumulative Data
- 2021 Cumulative Data
- 2020 Cumulative Data
- 2019 Cumulative Data
- 2018 Cumulative Data
- 2017 Cumulative Data
- 2016 Cumulative Data
- 2015 Cumulative Data
- 2014 Cumulative Data
- 2013 Cumulative Data
- 2012 Cumulative Data
- 2011 Cumulative Data
- 2010 Cumulative Data
- 2009 Cumulative Data
- 2008 Cumulative Data
- 2007 Cumulative Data
- 2006 Cumulative Data
- 2005 Cumulative Data
- 2004 Cumulative Data
- 2003 Cumulative Data
File of fish data by year, by species, and several other formats for looking at all things DITL fish.