Greenland Rising
The Greenland Rising Science Project was a partnership between Greenlandic institutional partners, community members and U.S. researchers working together to develop predictions of future sea level change around Greenland. The investigation focused on implications for three communities in West Greenland, developing predictions for 2050 and 2100 for total sea level change and also who the impacts would be for the communities.
A key part of this work was developing education resources for the local schools in Greenland around the science of climate change, how we measure the changes, and what the effects of climate change are and will be on the local communities. The education resources were developed around a set of topics and are available below.
Greenland Rising Curriculum Resources
Curriculum Overview: The Lessons and Activities outline for the overall project that includes our opening discussion question: "How will Greenland's climate change affect you?" Each lesson includes:
- Student explanations and activities
- Teacher guides to the material
- A powerpoint to support the in classroom learning
Measuring Greenland -Student Version - Using data maps to 'size up' Greenland. Maps include surface satellite, ice velocity, ice thickness, without the ice, and ice history over the last 11,600 years.
Measuring Greenland - Teacher Version
Set of maps for student's discussion (in powerpoint - pptx)
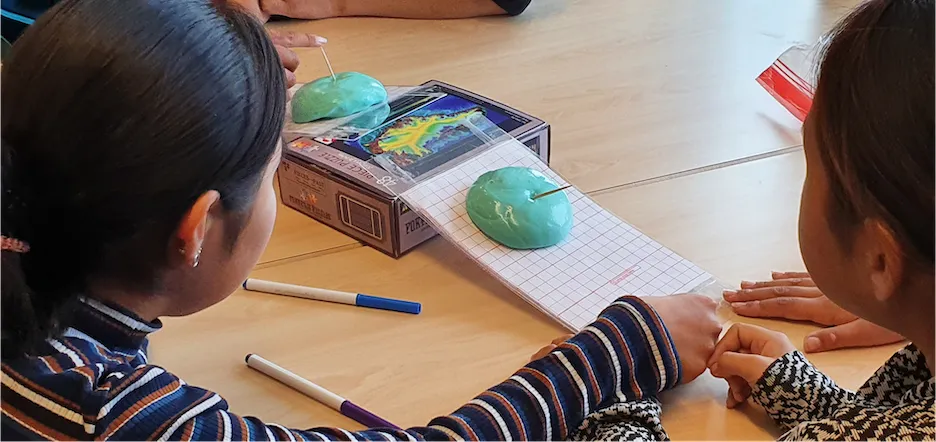
Understanding Ice Flow - Student Version - Ice moves under its own weight following the force of gravity. Ice behavior is fun to watch and follows the basic principles of physics. Do your own experimenting!
Student Worksheet (pdf) - To use with the activities
- Student Worksheet (word document version)
Presentation to guide the activity - powerpoint slides (pptx)
Understanding Ice Flow - Teacher Version
Sea Level Change (Land): An introduction to sea level change that discusses: What is sea level? Why do we measure it? How does it relate to Greenland's large amount of land ice? How do we measure it?
Presentation to Guide the Activities: Set of slides that support the activity.
Sea Level Change, Measuring Tides
Presentation Sea Level: Oceans & Tides - Classroom slides that support the activity
Introduction to Multibeam Mapping: An introduction to how we can use sound to measure ocean depth, and create not just a single depth measurement but 3 dimensional images of the bottom of the ocean.
Presentation of Underwater Mapping: Short Visualizations created of the harbor, Nuuk Greenland (bathymetry)
Presentation on how to create a 3D visualization from data (Higher Level Student): This activity can be done by high school students or done as a teacher led demonstration.
Lesson 7 Benthic (bottom) Habitats: This lesson has many activities and topics to explore. The background lesson introduces our connection to the benthic zone, a invisible space to most of us but a place that supports many species that link to the larger food web. This lesson is brings together the many different activities, which can be done together or independently.
Activity 7.1 Life on the Coast: A slide presentation that introduces students to Greenlandic marine species, ecosystems and habitats.
Activity7.2 Life on the Coast Quiz: A fun quiz to see what species students might know from Greenland's coast. The quiz is included in a powerpoint presentation and includes a section on seals as well!
Activity 7.3 West Greenland Marine Food Web: Building connections! See how many links you can make between the benthic species and species in the rest of the foodweb!
Activity 7.4a Benthic Habitats & Species Cards: Set of cards in English/Greenlandic and English/Danish that reviews 3 different benthic habitat classifications and identifies some of the species found there in both photographs and color sketches. These cards match to the activities 7.4b, 7.4c and
Activity 7.4b Aasiaat Benthic Species Photos: Test your knowledge! Use this presentation with the Benthic Habitat and Species Cards (7.4a) to see what you can identify! You will see a photo from the Aasiaat water bottom and try to identify as many species as you can in the image using your species cards. Each photo is repeated with some of the species identified (using Greenlandic names which are included on the Species cards as one of the 3 languages!). We are sure you can find more than we did!
Activity 7.4c Kullorsuaq Benthic Species Photos: Test your knowledge! Use this presentation with the Benthic Habitat and Species Cards (7.4a) to see what you can identify! You will see a photo from the Kullorsuaq water bottom and try to identify as many species as you can in the image using your species cards. Each photo is repeated with some of the species identified (using Greenlandic names which are included on the Species cards as one of the 3 languages!). We are sure you can find more than we did!
Activity 7.4d Greenland Rising youtube benthic videos: Click to go to the video page! Here you will find 5 short underwater videos collected with an underwater camera along Greenland's coast. Use your Benthic Habitat and Species Cards to see what you can identify while the camera rolls! We recommend starting with the Moon Jelly: Aasiaat short video where we have provided some clues for you!
Activity Support 7.4ds (student) Recording Sheets to use with the underwater images 7.4b, 7.4c or 7.4d.
Teacher Version Lesson 7: Benthic (bottom) Habitats
Activity Lesson 7.4dt (teacher): Aasiaat video recording sheet to use with the Aasiaat underwater video 7.4d.
Project Storymap: The main Storymap is a project overview including audio sectional summaries in 3 languages (Greenlandic, Danish and English). Three individual storymaps are linked off the main map, each of which tells the story of the project work in one of the Greenland communities we worked in:
An interactive benthic map of the local waterfront is included in each with project with clickable images of species from the bottom of the coast.