A New 66 Million-Year History of Carbon Dioxide Offers Little Comfort for Today
Scientists have produced a new curve of how atmospheric carbon dioxide affects climate. It makes clear that its effects can be long lasting.
A massive new review of ancient atmospheric carbon-dioxide levels and corresponding temperatures lays out a daunting picture of where the Earth’s climate may be headed. The study covers geologic records spanning the past 66 million years, putting present-day concentrations into context with deep time. Among other things, it indicates that the last time atmospheric carbon dioxide consistently reached today’s human-driven levels was 14 million years ago—much longer ago than some existing assessments indicate. It asserts that long-term climate is highly sensitive to greenhouse gas, with cascading effects that may evolve over many millennia.
The study was assembled over seven years by a consortium of more than 80 researchers from 16 nations. It appears today in the journal Science.
“We have long known that adding CO2 to our atmosphere raises the temperature,” said Bärbel Hönisch, a geochemist at Columbia University’s Lamont-Doherty Earth Observatory, who coordinated the consortium. “This study gives us a much more robust idea of how sensitive the climate is over long time scales.”

Mainstream estimates indicate that on scales of decades to centuries, every doubling of atmospheric CO2 will drive average global temperatures 1.5 to 4.5 degrees Celsius (2.7 to 8.1 Fahrenheit) higher. However, at least one recent widely read study argues that the current consensus underestimates planetary sensitivity, putting it at 3.6 to 6 C degrees of warming per doubling. In any case, given current trends, all estimates put the planet perilously close to or beyond the 2 degrees warming that could be reached this century, and which many scientists agree we must avoid if at all possible.
In the late 1700s, the air contained about 280 parts per million (ppm) of CO2. We are now up to 420 ppm, an increase of about 50%; by the end of the century, we could reach 600 ppm or more. As a result, we are already somewhere along the uncertain warming curve, with a rise of about 1.2 degrees C (2.2 degrees F) since the late 19th century.
Whatever temperatures eventually become manifest, most estimates of future warming draw information from studies of how temperatures tracked with CO2 levels in the past. For this, scientists analyze materials including air bubbles trapped in ice cores, the chemistry of ancient soils and ocean sediments, and the anatomy of fossil plant leaves.
The consortium’s members did not collect new data; rather, they came together to sort through published studies to assess their reliability, based on evolving knowledge. They excluded some that that they found outdated or incomplete in the light of new findings, and recalibrated others to account for the latest analytical techniques. Then they calculated a new 66-million-year curve of CO2 versus temperatures based on all the evidence so far, coming to a consensus on what they call “earth system sensitivity.” By this measure, they say, a doubling of CO2 is predicted to warm the planet a whopping 5 to 8 degrees C.

The giant caveat: Earth system sensitivity describes climate changes over hundreds of thousands of years, not the decades and centuries that are immediately relevant to humans. The authors say that over long periods, increases in temperature may emerge from intertwined Earth processes that go beyond the immediate greenhouse effect created by CO2 in the air. These include melting of polar ice sheets, which would reduce the Earth’s ability to reflect solar energy; changes in terrestrial plant cover; and changes in clouds and atmospheric aerosols that could either heighten or lower temperatures.
“If you want us to tell you what the temperature will be in the year 2100, this does not tell you that. But it does have a bearing on present climate policy,” said coauthor Dana Royer, a paleoclimatologist at Wesleyan University. “It strengthens what we already thought we knew. It also tells us that there are sluggish, cascading effects that will last for thousands of years.”
Hönisch said the study will be useful for climate modelers trying to predict what will happen in coming decades, because they will be able to feed the newly robust observations into their studies, and disentangle processes that operate on short versus long time scales. She noted that all the project’s data are available in an open database, and will be updated on a rolling basis.
The new study, covering the so-called Cenozoic era, does not radically revise the generally accepted relationship between CO2 and temperature, but it does strengthen the understanding of certain time periods, and refines measurements of others.
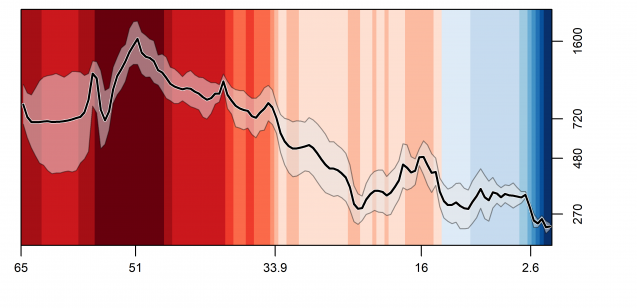
The most distant period, from about 66 million to 56 million years ago, has been something of an enigma, because the Earth was largely ice free, yet some studies had suggested CO2 concentrations were relatively low. This cast some doubt on the relationship between CO2 and temperature. However once the consortium excluded estimates they deemed the least dependable, they determined that CO2 was actually quite high—around 600 to 700 parts per million, comparable to what could be reached by the end of this century.
The researchers confirmed the long-held belief that the hottest period was about 50 million years ago, when CO2 spiked to as much as 1,600 ppm, and temperatures were as much as 12 degrees C higher than today. But by around 34 million years ago, CO2 had dropped enough that the present-day Antarctic ice sheet began developing. With some ups and downs, this was followed by a further long-term CO2 decline, during which the ancestors of many modern-day plants and animals evolved. This suggests, the paper’s authors say, that variations in CO2 affect not only climate, but ecosystems.
The new assessment says that about 16 million years ago was the last time CO2 was consistently higher than now, at about 480 ppm; and by 14 million years ago it had sunk to today’s human-induced level of 420 ppm. The decline continued, and by about 2.5 million years ago, CO2 reached about 270 or 280 ppm, kicking off a series of ice ages. It was at or below that when modern humans came into being about 400,000 years ago, and persisted there until we started messing with the atmosphere on a grand scale about 250 years ago.
“Regardless of exactly how many degrees the temperature changes, it’s clear we have already brought the planet into a range of conditions never seen by our species,” said study coauthor Gabriel Bowen, a professor at the University of Utah. “It should make us stop and question what is the right path forward.”
The consortium has now evolved into a larger project that aims to chart how CO2 and climate have evolved over the entire Phanerozoic eon, from 540 million years ago to present.
