Lesson Plans About the Hudson Estuary
This set of lessons focuses on the Hudson Watershed and Estuary, emphasizing data collected from the annual event. Lessons that use data collected by the students themselves can be exciting for them to explore! We have sorted the activities into age brackets to make them easier for teachers to use but there is a wealth of wonderful material available here. These activities are both a great way to prepare for your annual Day in the Life event, and to reinforce the learning after the event. Note that many of these activities can be updated by replacing the data with that from the current year.
Additionally there are a wide range of excellent lessons and supporting resources about the Hudson that are available through the Hudson River Curriculum - Hudson River National Estuarine Research Reserve (hrnerr.org). This set of resources has been collected by the Hudson River Estuary Program. If you have questions about any of our resources please contact Rebecca Houser or Margie Turrin.
General Resources
Key vocabulary for the Day in the Life Event as well as studying the Hudson River estuary. Knowing basic information about the Hudson is empowering for the students before they participate in the actual event.
As a pre-event activity for Day in the Life we encourage your students to develop a set of predictions about what they might find in their sampling. This worksheet is designed to help them consider the different parameters they will be measuring at their study site. When combined with a look at prior years’ data and data from the closest HRECOS station, they are able to develop a fairly accurate set of predictions for what they might find at their site.
After the event students compare their collected data to their predictions!

We have found that for many of the lessons and activities are more meaningful for the students when they have a map of the estuary to work with. This map can also be used by students to locate their sampling site within the estuary, or to better understand the different sections of the estuary - Marine, Brackish and Fresh. While these sections are not fixed within the estuary (complete the Create a Data Visualization of Hudson River Salinity activity for more on this), generally we can identify areas that would fall into these categories.
- legal size map image of the estuary (can be set to print on letter size)
Elementary School Resources
In this activity students will work with salt data collected on different Day in the Life events. The years selected for the activity are 2008 and 2009. The years represent distinctly different conditions in the estuary (wet and dry). Work with your students to color and discuss what the map means. This will take some guidance on coloring by the teacher but with everyone working together and slowly coloring in the sections it can very successfully teach about how weather and salinity are connected in our estuary.
The Hudson River has a long past and pieces of that past can be found along the River’s edge. Bricks from the old brickyards, coal from the steam engines and factories, oyster shells from the past and present and so much more. Use this shet to hold a scavanger hunt on the rivert’s edge, and learn about each of these pieces as you travel.
Middle & High School Resources
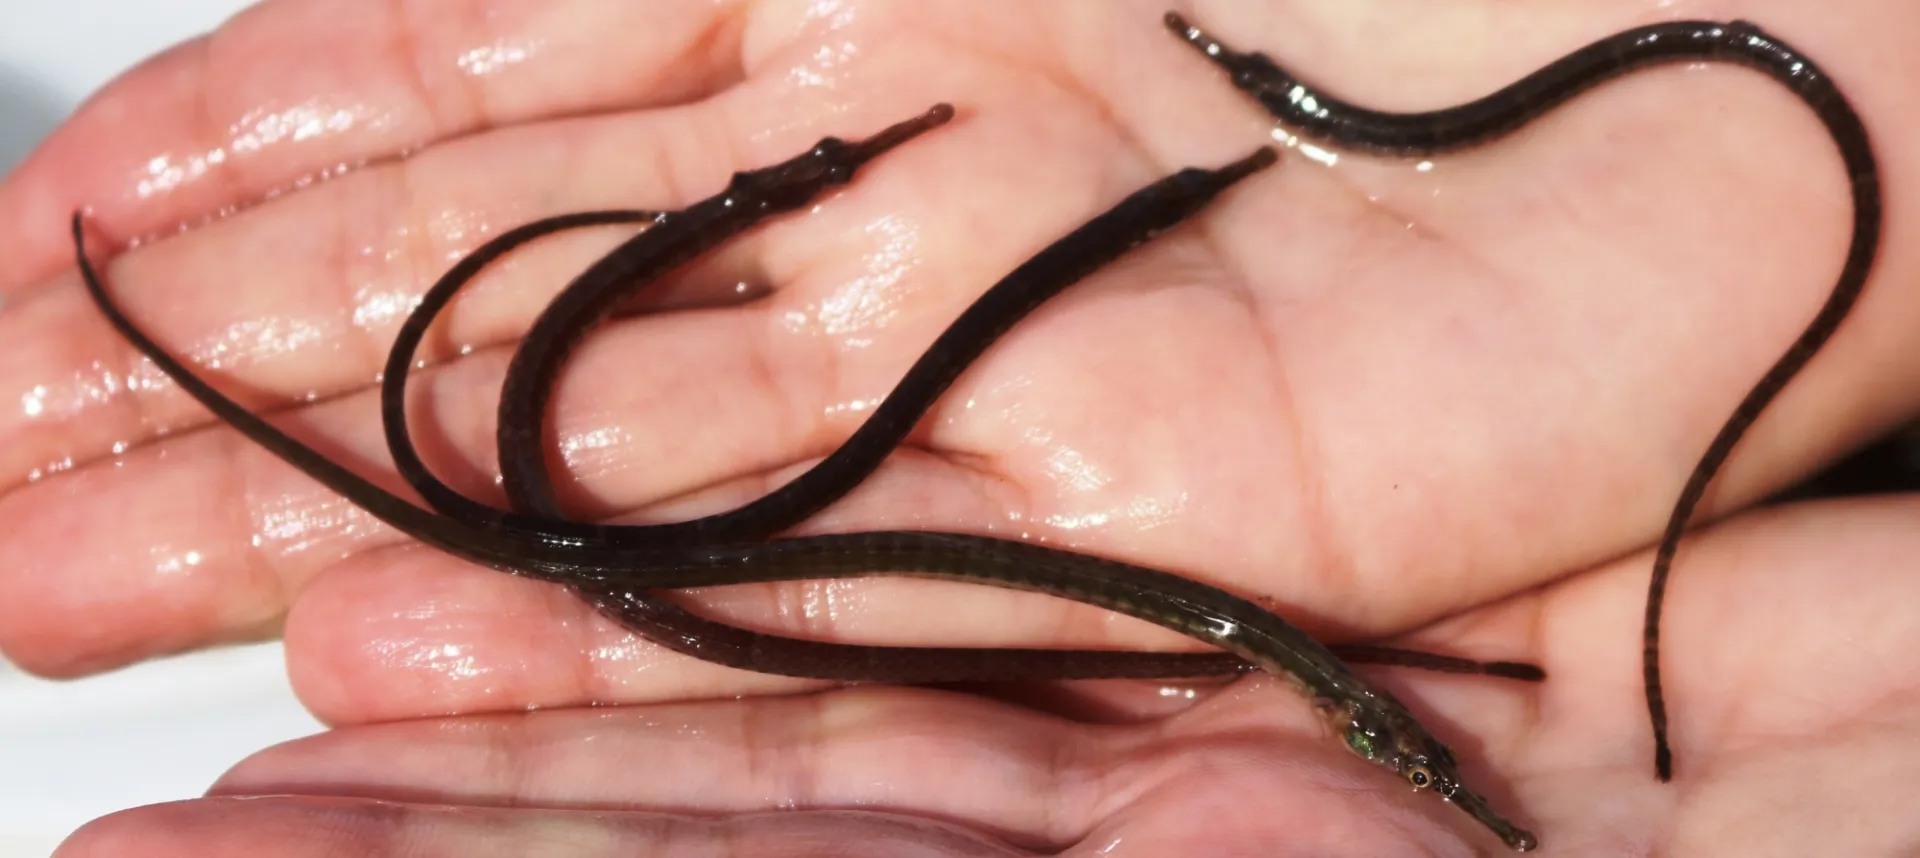
What defines a fish? Fish in the Hudson River may share a watery habitat, but aside from that, they can vary in every way imaginable. They are uniquely adapted to their niche in the ecosystem. This session will provide an overview of what makes a fish a fish, and share activities that educators can do with students to help them not only love fish, but understand their adaptations to live in an aquatic environment.
- All about Fish Fact Sheet
- Fish Fish Fish Activity (as a pdf)
- Fish Fish Fish Activity (as a pptx)
- Fish Fish Fish Teacher Notes
The Hudson is over 300 miles long but is it a river or an estuary? Through time something called 'river miles’ have been assigned to differentiate the sections, with river mile 0 identifying the start of the main stem waterway down in New York Harbor at the tip of the Battery. We will explore river miles from -10 in the Hudson Harbor (farther south than river mile 0), to 153 just north of Albany. To investigate the Hudson River, we must understand the differences between rivers and estuaries. We will do this through using STEM, exploring the fish, chemistry, salinity and habitats.
- Introduction to the Hudson (pdf version) or (pptx version)
- Investugations 1 & 2 (pdf version) or (pptx version)
- Investigation 3 (pdf version) or (pptx version)
- MIddle School
- Hudson STEM Acttivity Sheet that matches the pdf/pptx
- High School
- Hudson STEM Activity Sheet that matches the pdf/pptx
- Teacher Guide
- Hudson River STEM facts sheet
In this 'Data Visualization” activity we use salinity data collected on three different Day in the Life events. The years selected for the activity are 2008, 2009, and 2018. The years were selected as they represent distinctly different conditions in the estuary. Students color and interpret the map according to the provided data. We suggest you have different students work on different maps and then compare and contrast their findings as they hypothesize about what might be causing the differences in the system.The teacher notes point out some interesting discussion points.
A habitat is a place where an organism makes its home or an environment of living things, and every part of the Hudson River has a habitat that supports a range of species. Humans play a huge role in both habitat protection and destruction, in fact, even our most urban and heavily altered areas provide essential habitat to many species. Unfortunately, we have had an impact on and have altered many of the Hudson’s habitats. In response to this, New York and New Jersey have designated essential
habitat areas along the Hudson to protect native species.
- Hudson Habitat Activity (pdf version)
- Hudson Habitat Activity (pptx version)
- Activity Facts Sheet
Migrating fish are an important part of the Atlantic coastal region and the Hudson River fish community. These fish do not live in just one river or estuary but move freely in the larger network of connected waterways. Many migratory fish spend much of their life in the ocean, only coming into the estuary to spawn.
In the 19th century, it became apparent that fish were not in endless supply and some type of fisheries management was needed. Migratory fish present a special fisheries management challenge as they move between oceans and river systems during different times in their life cycle. In their migration, they move freely between ocean and state waterways, and therefore are best managed on a coast-wide basis. The American shad and the striped bass are two important migratory fish of the Hudson River. This activity focuses on some of the challenges of managing these two species.
- Migratory Fish activity (as a pdf)
- Migratory Fish activity (as a pptx)
- Fish on the Move Fact Sheet
This activity explores 2 questions:
- In the absence of technical models, are there biological indicators of the salt front that we could rely on?
- How do data collected by students in the ‘Day in the Life’ event compare to USGS model results?
For this activity you will need:
This activity looks at the connection of Hudson River sediments to their natural and human origins and can be completed:
- In the field as a supplement to coring
- As a scavenger hunt with or without sediment coring
- Back in the classroom after the field day is completed